HW 02
Class: STAT-211
Notes:
1.
There are four different data sets. Match them to the correct boxplot and histogram (both of them need to be matched). And each data set matches exactly one of the four boxplots and histograms.
Hint: You may try to match boxplot first, then try to match histogram.
| Data Set 1: Mean: 52.32 Median: 53 Std Dev: 38.297 |
Data Set 2: Mean: 67.8 Median: 74 Std Dev: 17.049 |
Data Set 3: Mean: 49.4 Median: 50 Std Dev: 20.265 |
Data Set 4: Mean: 47.88 Median: 41 Std Dev: 19.020 |
|---|
A B B C  D  |
I II II III  IV  |
| Data Set | Boxplot | Histogram |
|---|---|---|
| Data Set 1 | B | IV |
| Data Set 2 | C | I |
| Data Set 3 | A | III |
| Data Set 4 | D | II |
2.
Phytopigments are a marker of the amount of organic matter that settles in sediments. Phytopigment concentrations in deep-sea sediments collected worldwide showed a very strong right-skew. Of these two summary statistics, 0.01 and 0.017 grams of phytopigment per square meter of bottom surface, which one is the mean and which one is the median and why?
- Since the distribution is strongly right-skewed, we expect the mean to be larger than the median. Therefore 0.017 is the mean and 0.01 the median.
- Since the distribution is strongly right-skewed, we expect the mean to be smaller than the median. Therefore 0.017 is the median and 0.01 the mean.
- We cannot tell which is the mean and which is the median without looking at the data.
3.
Provided below are a histogram and the five number summary for salaries (in $) for a random sample of U.S. marketing managers.

| Minimum | Q1 | Median | Mean | Q3 | Maximum |
|---|---|---|---|---|---|
| 46360 | 69693 | 77020 | 80183 | 91750 | 129420 |
The IQR for these data is
- $22,057
- $83,060
- $3,163
- $14,730
Process:
4.
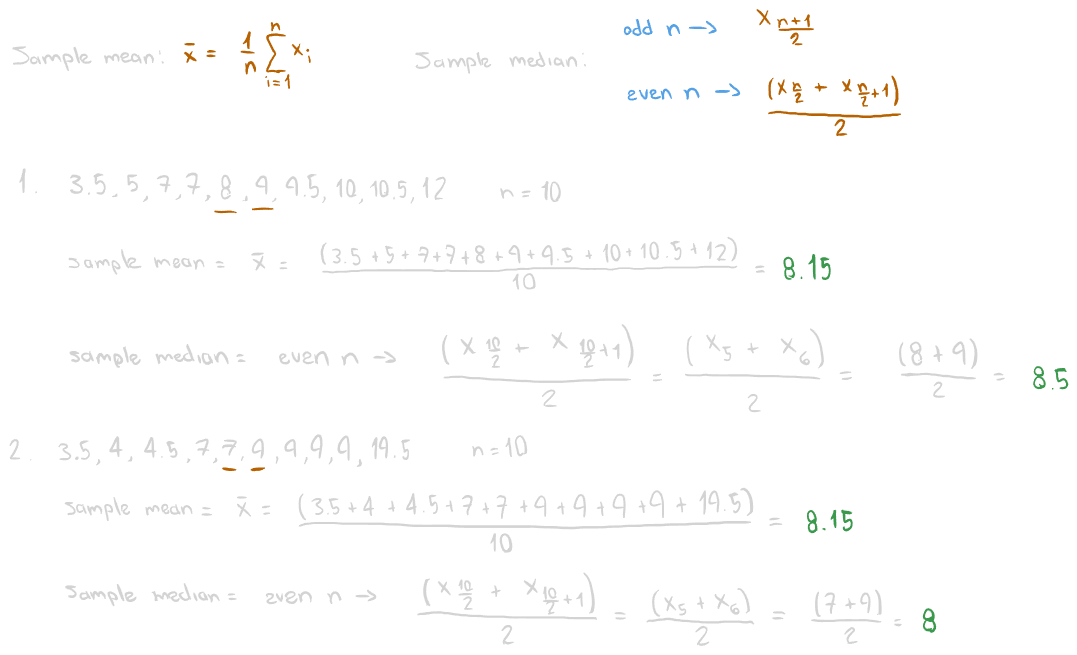
A sample of students from Texas A&M University were asked how many hours they slept on Wednesday night, to the nearest half. The results are as follows:
7, 9.5, 8, 9, 5, 3.5, 10.5, 7, 10, 12
- a) Find the sample average (2 decimal places): 8.15
- b) Find the sample median: 8.5
We asked the same ten college students how much sleep they got on Friday night, the results look like this:
9, 7, 4, 9, 3.5, 7, 9, 4.5, 9, 19.5
- a) Find the sample average (2 decimals): 8.15
- b) Find the sample median: 8
What could you say about the difference in sleep for Friday night verses Wednesday night?
- They have exactly the same center and spread
- They have very different centers, but the spreads are about the same
- They have about the same center, but Friday night is more spread out
5.
This question is about reading the mathematical formulas. Try doing the computations using the formulas for this small data set: 11, 20, 5, 17, 31. Parts (a)--(i) below, guide you through this step-by-step.
(a) number of observations,
(b) sum of the observations,
(c) mean, =
(d)
- Here,
refers to the first data value, which is 11. - 11 - 16.8 = -5.8
(e)
(f)
(g)
(h) variance,
- Remember
(i) standard deviation, s = 9.81
- Remember
6.
Identify the correct match of the Upper, Middle and Lower boxplots with the estimated densities 1, 2 and 3.


- Upper - 2; Middle - 3; Lower - 1;
- Upper - 2; Middle - 1; Lower - 3;
- Upper - 1; Middle - 2, Lower - 3;
- Upper - 3; Middle - 1; Lower - 2;
- Upper - 3; Middle - 2; Lower - 1;
- Upper - 1; Middle - 3; Lower - 2;
7.
I asked four of my coworkers how many pushups they could do. After a brief contest the results were:
12
32
72
96
Find the standard deviation of these numbers.
Use two decimals
s = 38
8.
Consider the following dataset:
13, 9, 18, 10, 7, 11, 8, 21, 12, 13, 8, 10, 12, 14, 14, 11, 12, 16, 15, 17, 15, 14, 18, 19, 20, 21, 23, 25, 24, 16, 18, 19.
(a) Compute the median for the above data. 14.5
(b) Compute the first quartile for the above data. 11.75
(c) Compute the third quartile for the above data. 18.25
(d) Find the interquartile range (IQR) for the above data. 6.5
9.
The CNN article found here says, "A proven way to ease anxiety naturally is with a bout of cardio." A friend of yours commented that she tried running the morning of tough exams but experienced no difference in her anxiety levels, so clearly, the study must be a fraud. Which of the following statements is correct?
- The study only shows that the average anxiety level of all participants is reduced; it does not guarantee that all participants had reduced anxiety.
- In order for the study to be correct, we must now add your friend's results to those of the study and recompute the new average.
- Because your friend did not experience lower anxiety, the study must not be correct.
- Your friend must not have followed the instructions on cardio correctly because she did not experience lower anxiety.
10.
The boxplot below shows the amount of time it takes a student to run a mile. A summary of that data is one of the options below. Mark which data set summary matches the boxplot.
/STAT-211/Visual%20Aids/Pasted%20image%2020250907194543.png)
Mean=5.5
Std Dev=5
Median=6.5
Mean=5.5
Std Dev=8
Median=6.5
Mean=6
Std Dev=1
Median=5.5
- Note how the distribution is a little bit more skewed to the 6
Mean=7.5
Std Dev=6
Median=7.5
Mean=5.5
Std Dev=4
Median=5.5
Mean=5
Std Dev=7
Median=9
11.
Below is plotted a histogram of the lengths of 44 sharks (including some not yet fully mature). Lengths are in feet, and no shark was measured to be exactly an integer number of inches: none are on the border. Which of the following is true?
/STAT-211/Visual%20Aids/Pasted%20image%2020250907194813.png)
- About 5% of the sharks in this data set are between 12 and 13 feet long.
- There are 7 sharks shorter than 13 feet in this data set.
- The typical shark in this data set is about 5 feet long.
- There are 10 sharks shorter than 2 feet in this data set.
- The lengths of sharks in this data set range between 1 and 9 feet.
12.
Based on the following plot, how would you describe the data?
/STAT-211/Visual%20Aids/Pasted%20image%2020250907195107.png)
- None of the above since it is a bar graph
- Normally distributed
- Left skewed with no outlier
- Right skewed with no outlier
- Right skewed with an obvious outlier
- Left skewed with an obvious outlier
13.
Which of the following data sets should have the largest standard deviation?
- 1, 2, 3, 4, 5, 6
- 76, 77, 78, 79, 80, 81
- 0, 0, 0, 5, 5, 5
- 11, 12, 13, 14, 15, 16
- 31, 32, 33, 34, 35, 36
14.
There are two different boxplots.
a) Which of the following terms best describes the shape of the boxplot?

- Left skewed
- Symmetric
- Right skewed
- Bimodal
b) Which of the following terms best describes the shape of the boxplot?

- Left skewed
- Symmetric
- Bimodal
- Right skewed
15.
Sixteen students were asked how many electronic devices they had in their home.
8, 17, 32, 57, 10, 6, 41, 50, 17, 27, 56, 17, 16, 7, 53, 10
Calculate the five number summary
a) Minimum: 6
b) Q1: 10
c) Median: 17
d) Q3: 45.5
e) Maximum: 57
f) What is the IQR? 35.5
16.
The histogram below shows the results from a survey asking 100 random kindergarten Americans "How many states in the US have you visited?"

a) Based on the histogram, what percentage of kindergartners have visited 4 or 5 states? (answer to 2 decimals)
Answer: 20 (visually)
b) Based on the histogram, what percentage of kindergartners have visited at least two states? (answer to 2 decimals - and use the percentage as a decimal between 1 and 0)
Answer: 0.85 (visually)
17.
The picture below has three lines marked A, B, and C. One is the mean, one is the median, and one is the mode. Which one is which?

| A | Mode |
| B | Median |
| C | Mean |
The curve is right-skewed (positively skewed): the long tail extends to the right.
For skewed distributions, the relationship is:
Mode < Median < Mean
Looking at the vertical lines:
- A is at the peak (highest frequency) → Mode
- B is in the middle → Median
- C is pulled farthest to the right (toward the skewed tail) → Mean
18.
Match each histogram/boxplot with one of the following descriptions: Skewed to the left, symmetric and bimodal, symmetric and unimodal, skewed to the right. Remark: Please ignore the diamonds in the boxplots, this is something odd that the statistical software puts in.

- A - Symmetric and unimodal, B - Symmetric and Bimodal, C - Skewed to the right, D - Skewed to the left
- A - Symmetric and bimodal, B - Symmetric and Unimodal, C - Skewed to the left, D - Skewed to the right
- A - Symmetric and unimodal, B - Symmetric and Bimodal, C - Skewed to the left, D - Skewed to the right
- A - Symmetric and bimodal, B - Symmetric and Unimodal, C - Skewed to the right, D - Skewed to the left
- None of the above descriptions match the given histograms
19.
A study records the sex and weight (in kilograms) of 30 recently born bear cubs in Alaska. Which of the following statements is true?
- Sex is a quantitative variable and weight is a categorical variable.
- Sex and weight are both categorical variables.
- Sex and weight are both quantitative variables.
- Sex is a categorical variable and weight is a quantitative variable.
The Statistical Abstract of the United States, prepared by the Census Bureau, provides the number of single-organ transplants for 2003 by organ. Assume that all types of single-organ transplants are presented below. The following two exercises are based on this table:
Heart 2034 Kidney 15146
Lung 1094 Pancreas 468
Liver 5047 Intestine 140
The data on single-organ transplants can be displayed in
- a pie chart but not a bar graph.
- a bar graph but not a pie chart.
- either a pie chart or a bar graph.
- neither a pie chart nor a bar graph
Kidney transplants represented what percent of single-organ transplants in 2003?
about 63%
about 37%
about 58%
This percent cannot be calculated from the information provided in the table.
- Calculated from a simple rule of 3
20.
The average salary of all female workers at a company is $44,000. The average salary of all male workers is $52,000. What must be true about the average salary of all workers?
- It could be any number between $44,000 and $52,000.
- It must be larger than $48,000.
- It must be larger than the median salary.
- It must be $48,000.
- It must be smaller than $48,000.
21.
Consider the following dataset:
10, 12, 12, 14, 14, 16, 16, 20, 22, 23, 23, 24, 25, 25, 27, 30, 35.
(a) Compute the median for the above data. 22
(b) Compute the first quartile for the above data. 14
(c) Compute the third quartile for the above data. 25
(d) Find the interquartile range (IQR) for the above data. 11
22.
Identify the correct match of the upper, middle and lower boxplots with their corresponding Histograms 1, 2, and 3.


- Upper - 2; Middle - 3; Lower - 1;
- Upper - 2; Middle - 1; Lower - 3;
- Upper - 3; Middle - 2; Lower - 1;
- Upper - 3; Middle - 1; Lower - 2;
- Upper - 1; Middle - 2, Lower - 3;
- Upper - 1; Middle - 3; Lower - 2;
23.!
Variability is a measure of the variance or diversity in the values of a data set.
A survey noted the color of random cars and random boats. The categorical data was graphed using the bar charts shown. Which one has greater variability?
 |
 |
|---|---|
| Answer: Right |
A survey noted the net worth of random college students and random retirees. The numerical data was graphed using the histograms shown. Which one has greater variability?
 |
 |
|---|---|
| Answer: Right |
College Students (Left Graph)
- Net worth ranges roughly from –3 to +3.
- That’s a range of about 6 units.
- Most data are clustered near –2, 0, and 2.
Retirees (Bottom Graph)
- Net worth ranges roughly from –10 to +10.
- That’s a range of about 20 units.
- The data are spread out more evenly across this wide range.
Conclusion
- The retirees’ histogram shows a much wider spread of net worth values than the students’ histogram.
24.
Identify the correct match of Boxplots A, B, and C with their corresponding Histograms i., ii., and iii.

- Boxplot A, Histogram ii; Boxplot B, Histogram i; Boxplot C, Histogram iii.
- Boxplot A, Histogram i; Boxplot B, Histogram iii, Boxplot C, Histogram ii.
- Boxplot A, Histogram iii; Boxplot B, Histogram i; Boxplot C, Histogram ii.
- Boxplot A, Histogram ii; Boxplot B, Histogram iii; Boxplot C, Histogram i.
- Boxplot A, Histogram iii; Boxplot B, Histogram ii; Boxplot C, Histogram i.